8 rising customers — growth momentum TRY 2,405,707
TRY 2,405,707HighSalesCRM
sales · accounts · stock · production
Without changing your ERP
the records in your ERP, right where they are
missed gain · value about to be lost
each finding comes with a recommended action
PULS works without changing your ERP.
Reads: takes the data from where it is — your ERP.
Detects opportunity and risk: the gain slipping away, the loss approaching.
Turns it into action: each finding comes with a recommended action.
From Data to Action — Before It’s Too Late!
The data is there. Few read it.
Source50–249 employees · Eurostat (TurkStat data), 2025
45.9% of medium-sized firms in Türkiye have an ERP.
Analyzing sales and payment records: 18.7%. Using business intelligence: 10.5%.
The data is there. Few read it.
higher is better · 16,515 firms
shorter is better · 17,100 firms
turnover rate 9.4 · 5.4 · 3.1
shorter is better · 16,637 firms
turnover rate 11.3 · 5.3 · 2.7
Margins are thin: no room for noticing late.
SourceCBRT (Central Bank of the Republic of Türkiye) Sector Balance Sheets · 2025 data · NACE G46 wholesale trade · medium size (CBRT class) · median = the middle firm · days = 365 / turnover rate
CBRT: the median net profit margin of a medium-sized wholesaler is 0.8%.
In a quarter of them, collection takes over ~118 days.
In a quarter of them, stock waits over ~135 days.
Margins are thin: no room for noticing late.




I designed PULS from my consulting experience at these 20 firms.
Four business models; in all of them the data is in the ERP, and few read it regularly.
Today two firms are PULS pilots.
The pilot metric: value detected and realized within six months.
A detected amount is exposure, not a gain.
The founder’s observation at 20 firms · consultant’s assessmentQuestions: Corporate Check-up · Finance
15/20can’t clearly see their cash for the next 3 months
13/20see their expense/sales ratio at year-end at the earliest
17/20don’t know their true profitability by productknow it with cost allocation: 0
My own observation at these 20 firms:
15 can’t clearly see their cash for the next 3 months.
13 see their expense/sales ratio at year-end at the earliest.
17 don’t know their true profitability by product.
Illustrative product screen · SAMPLE DATA
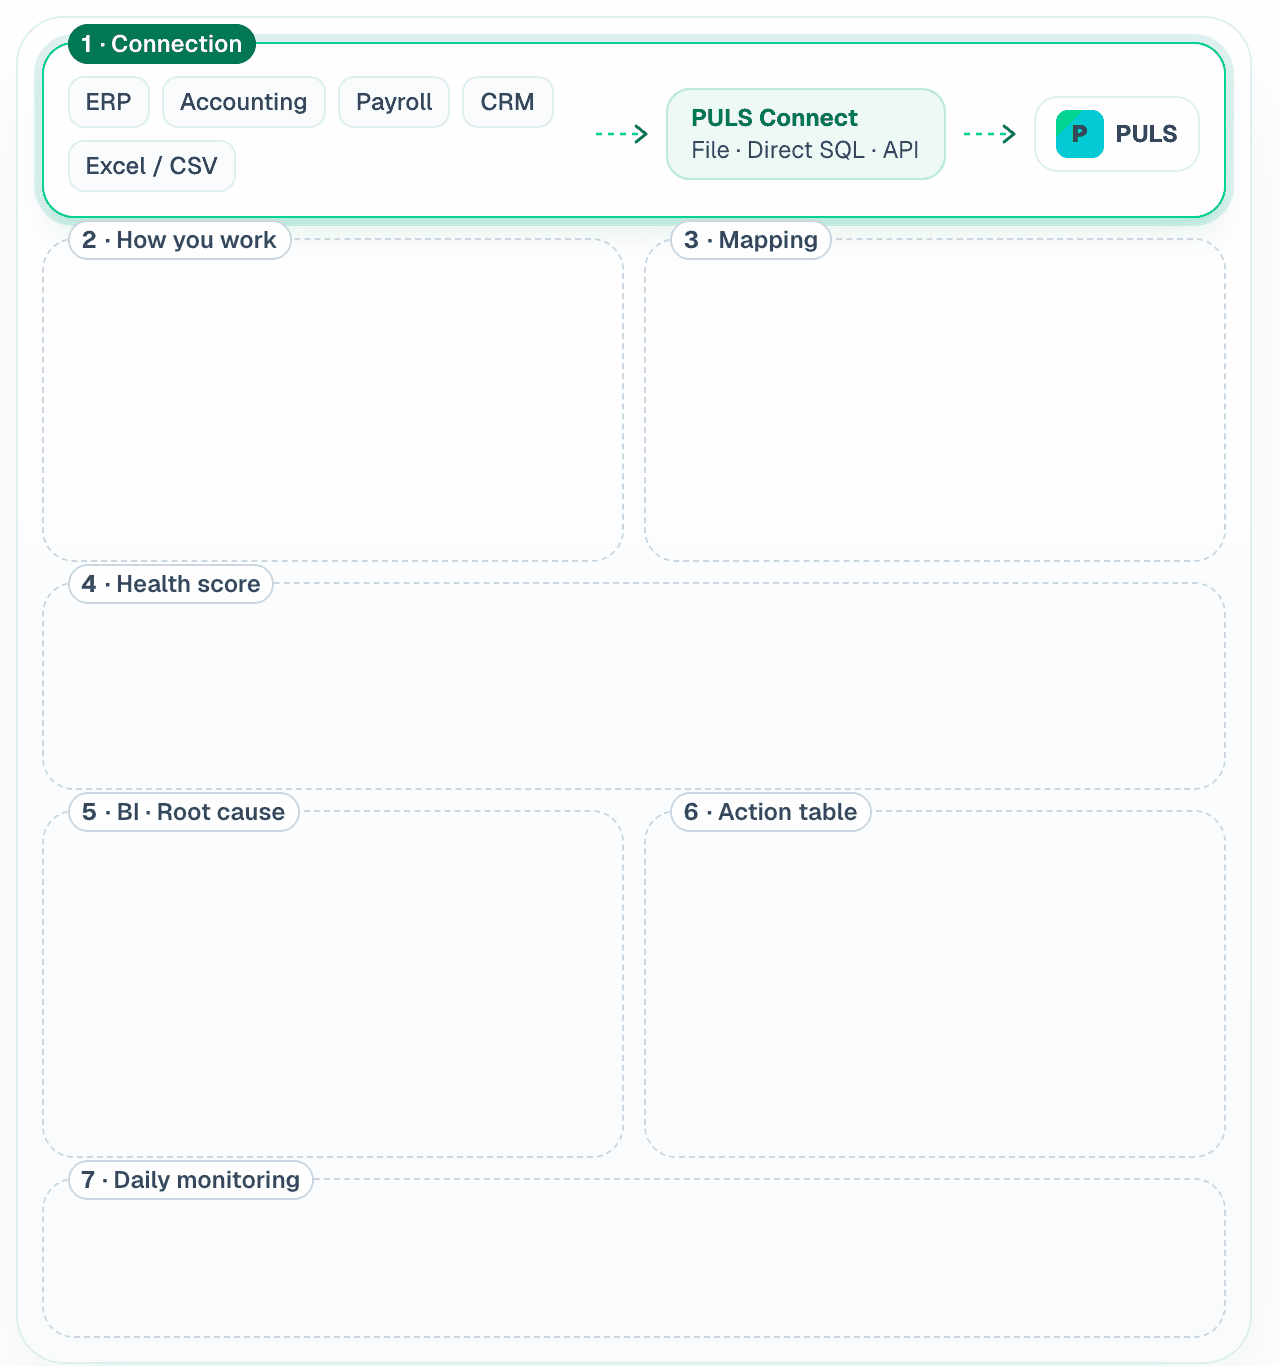
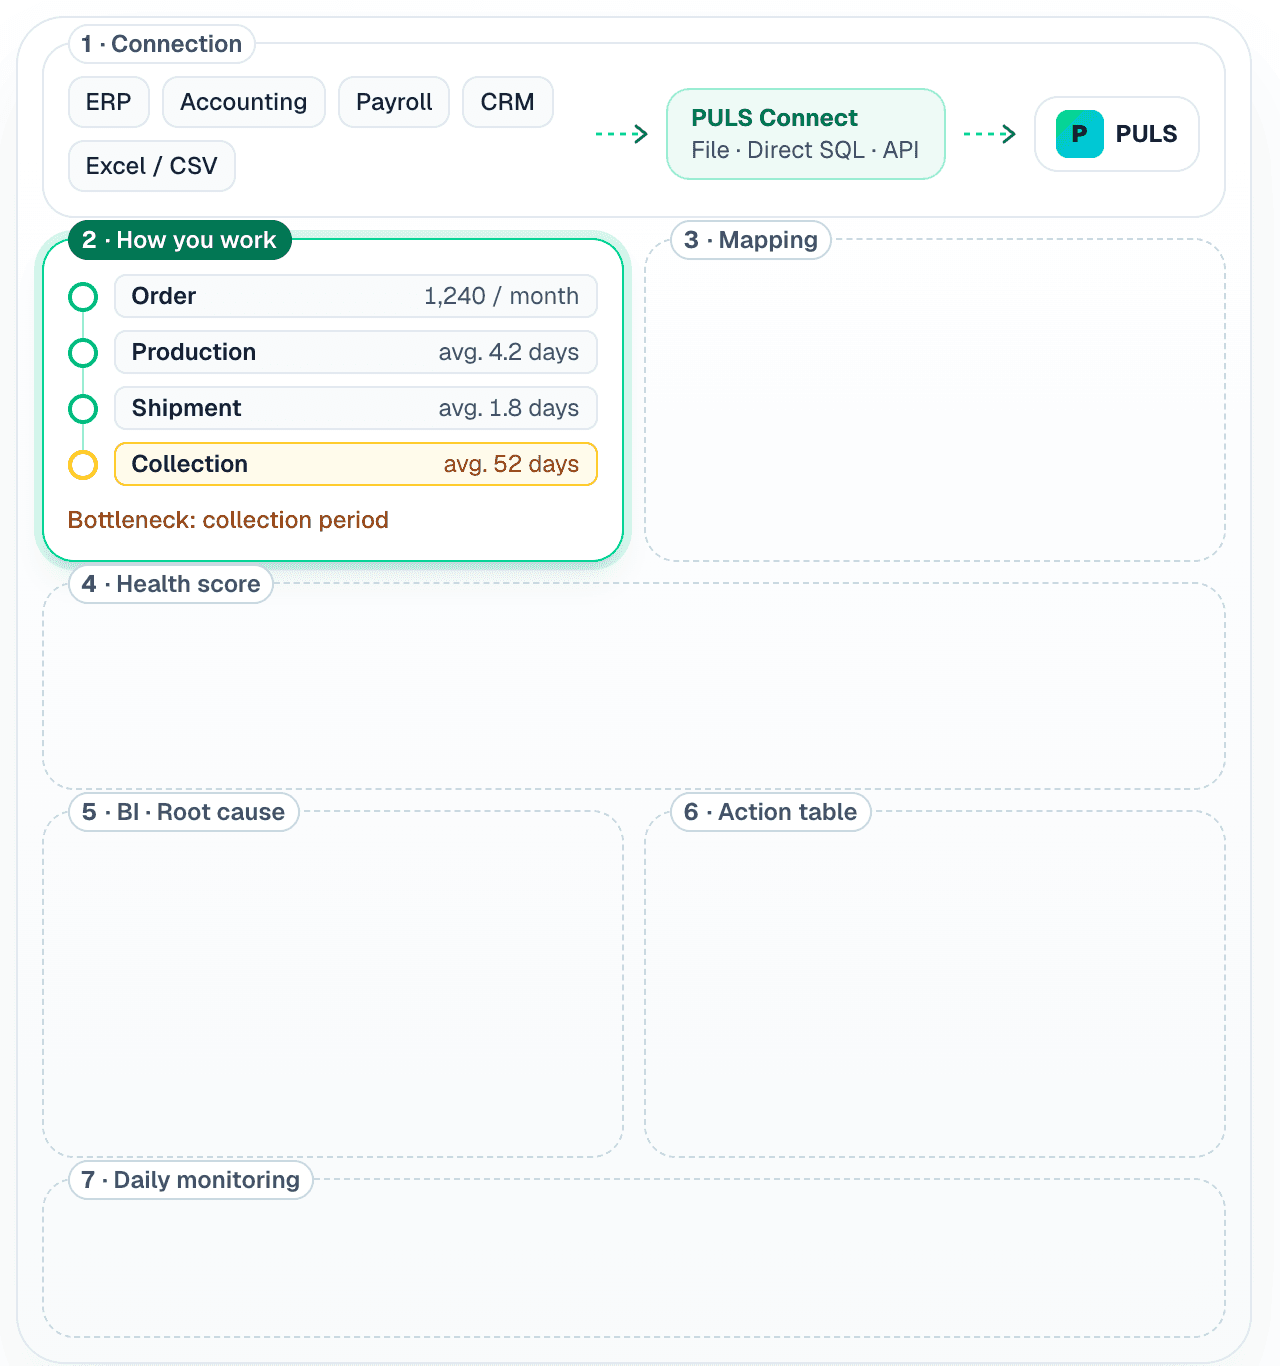
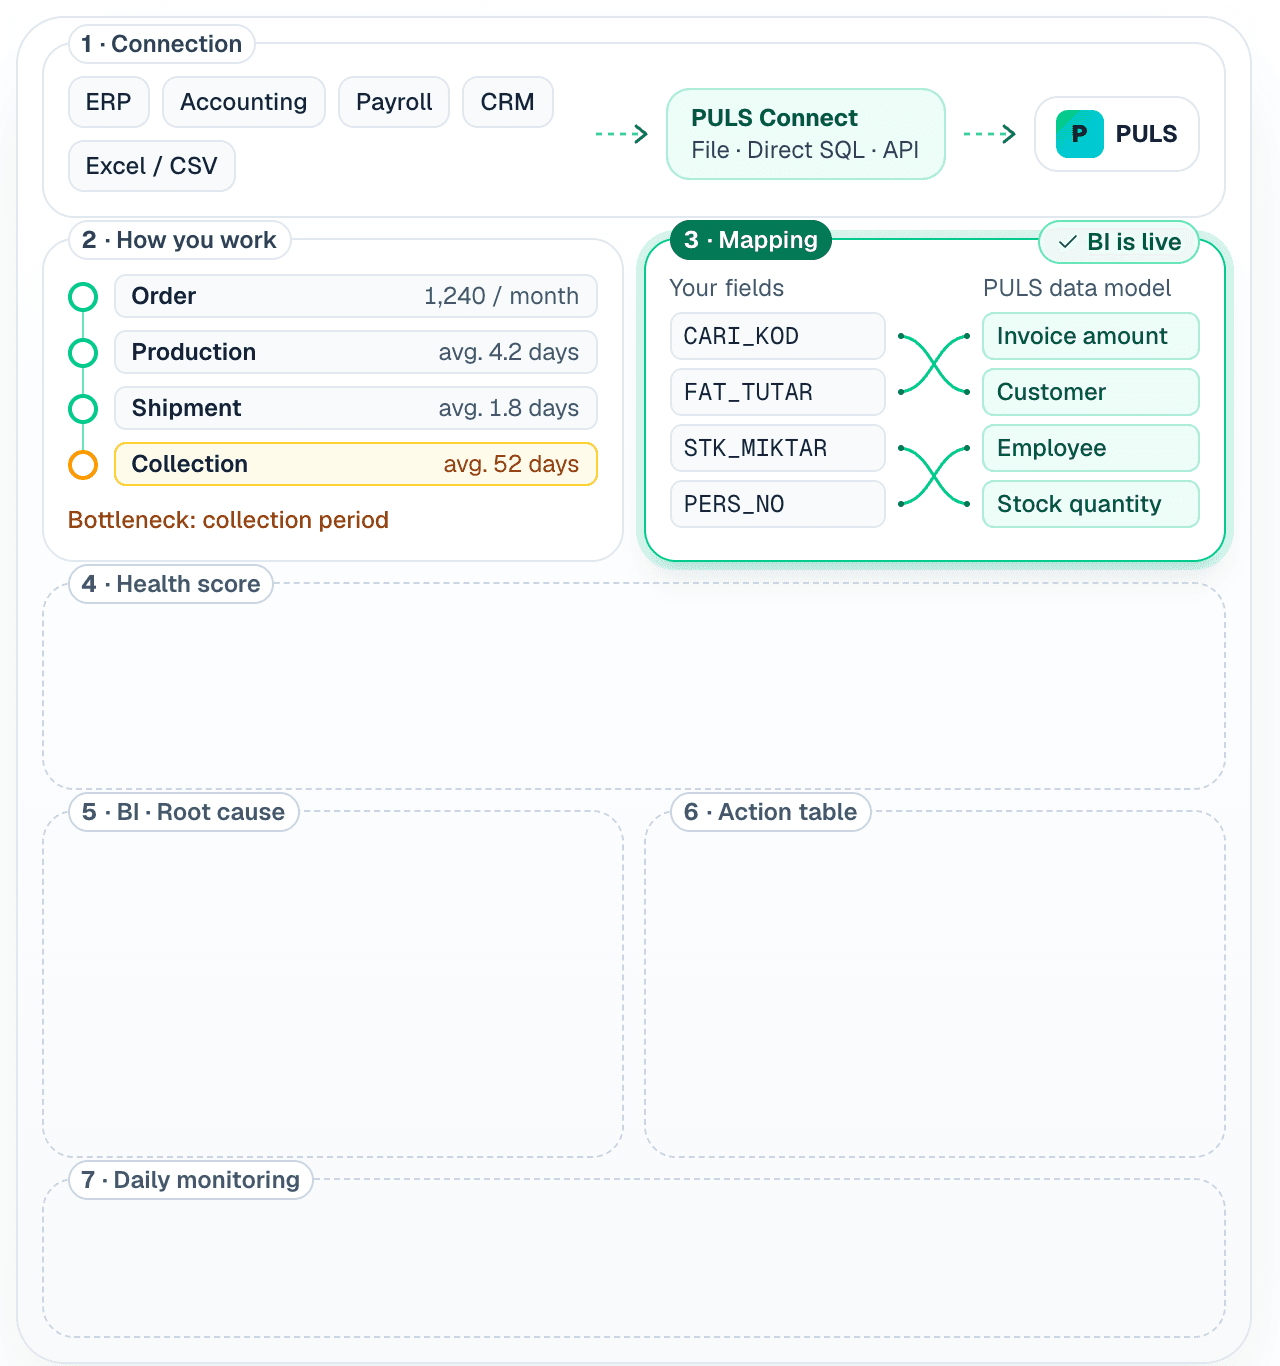
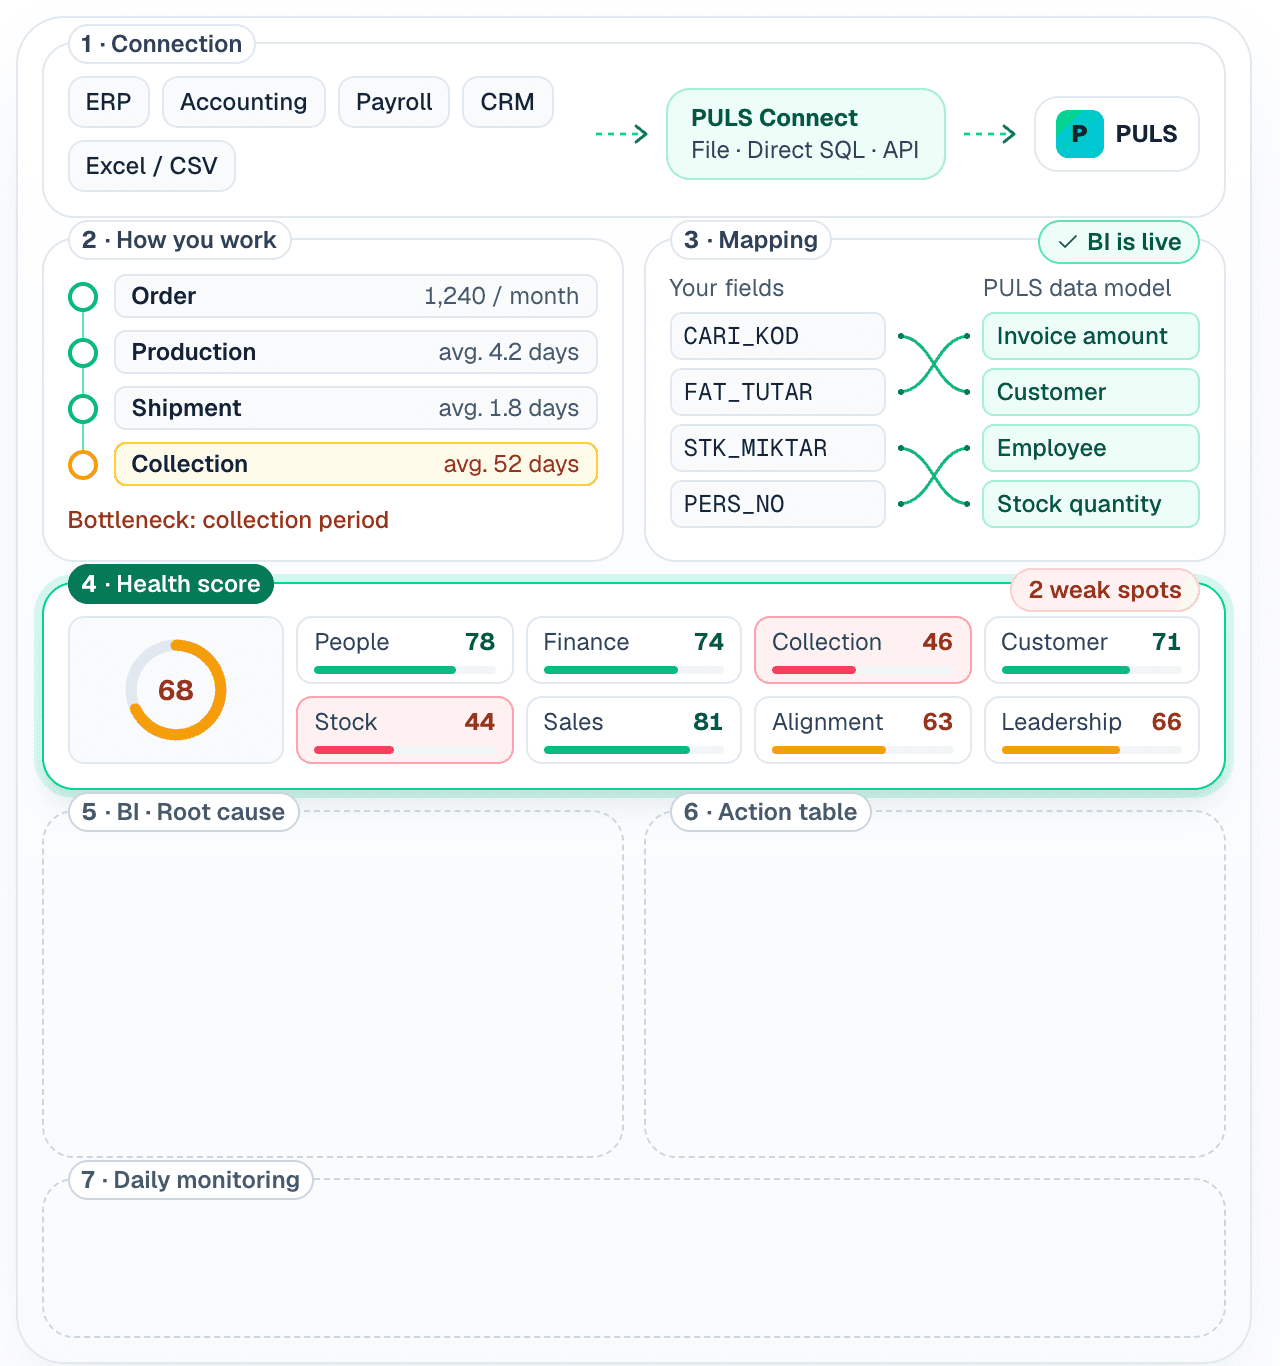
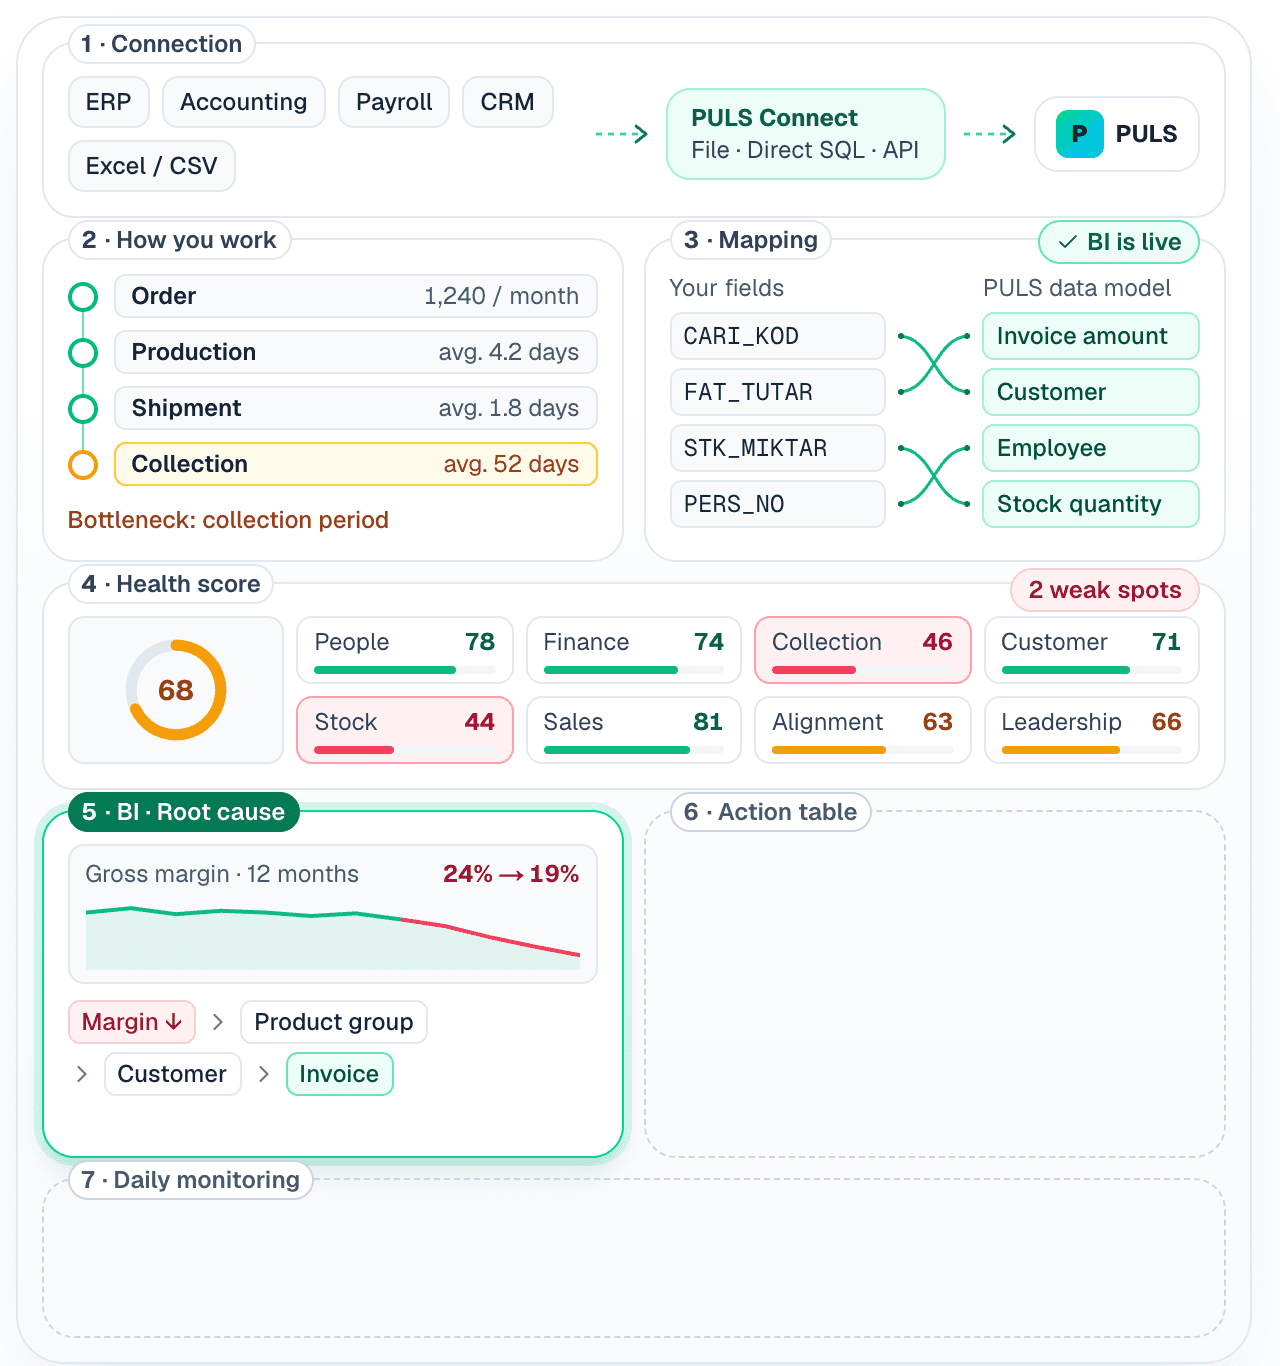
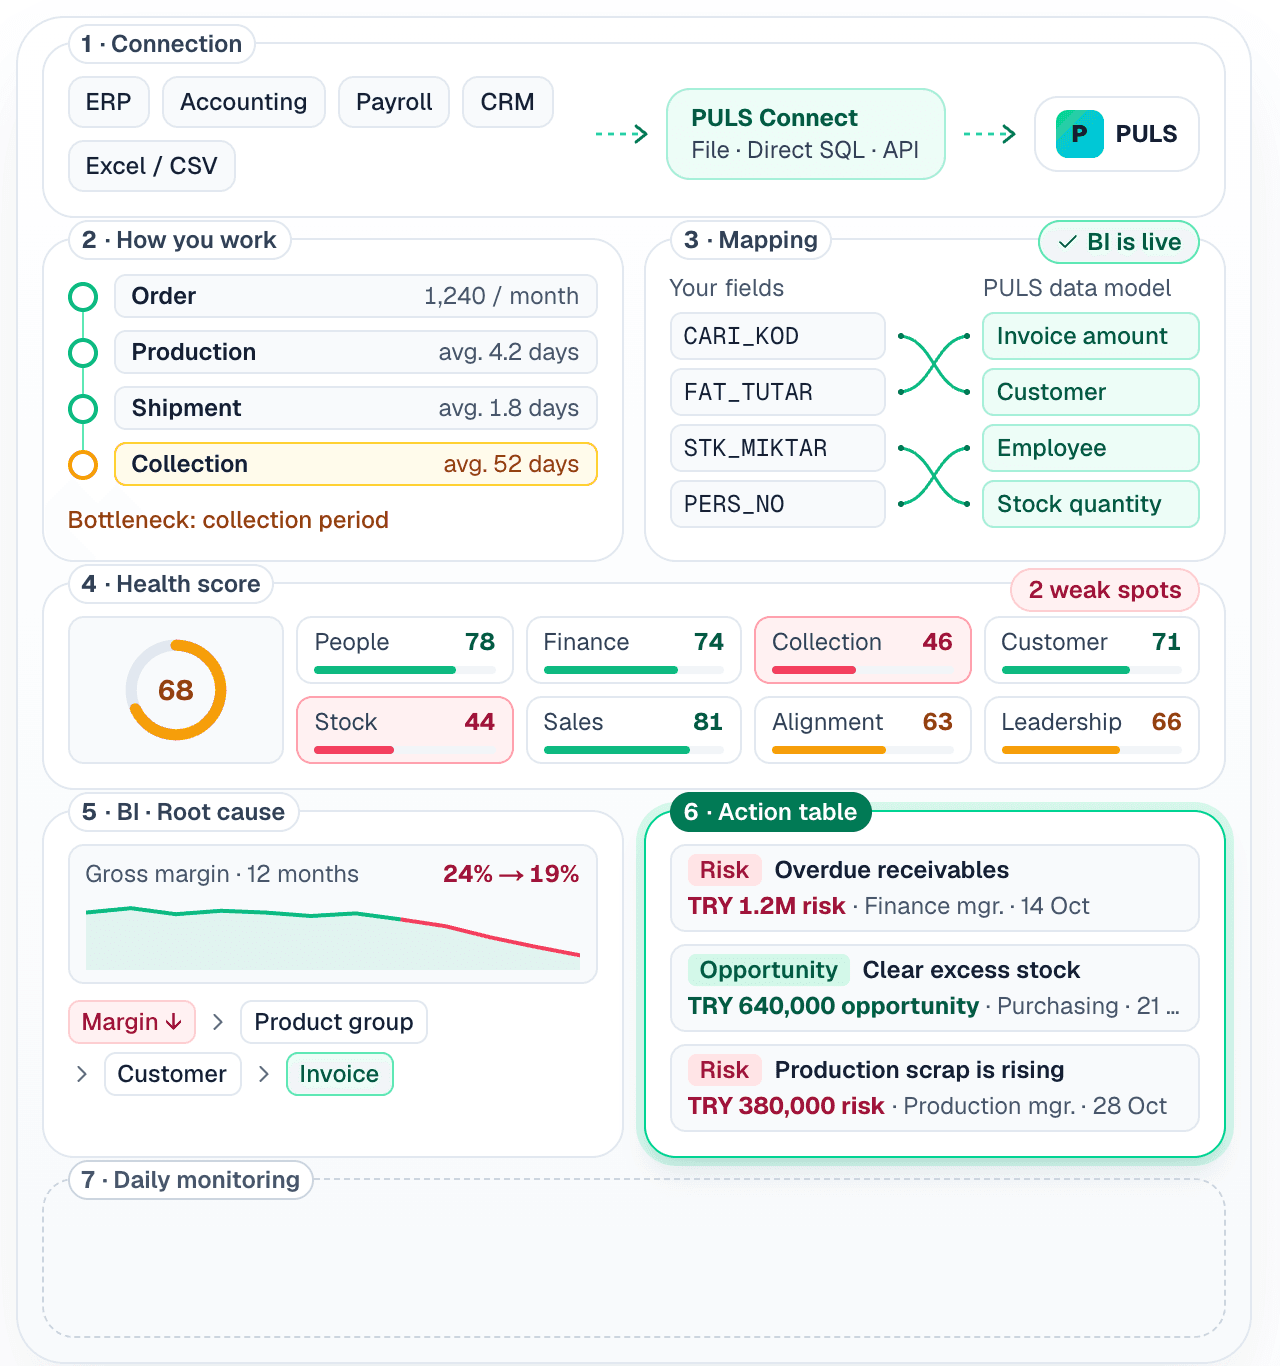
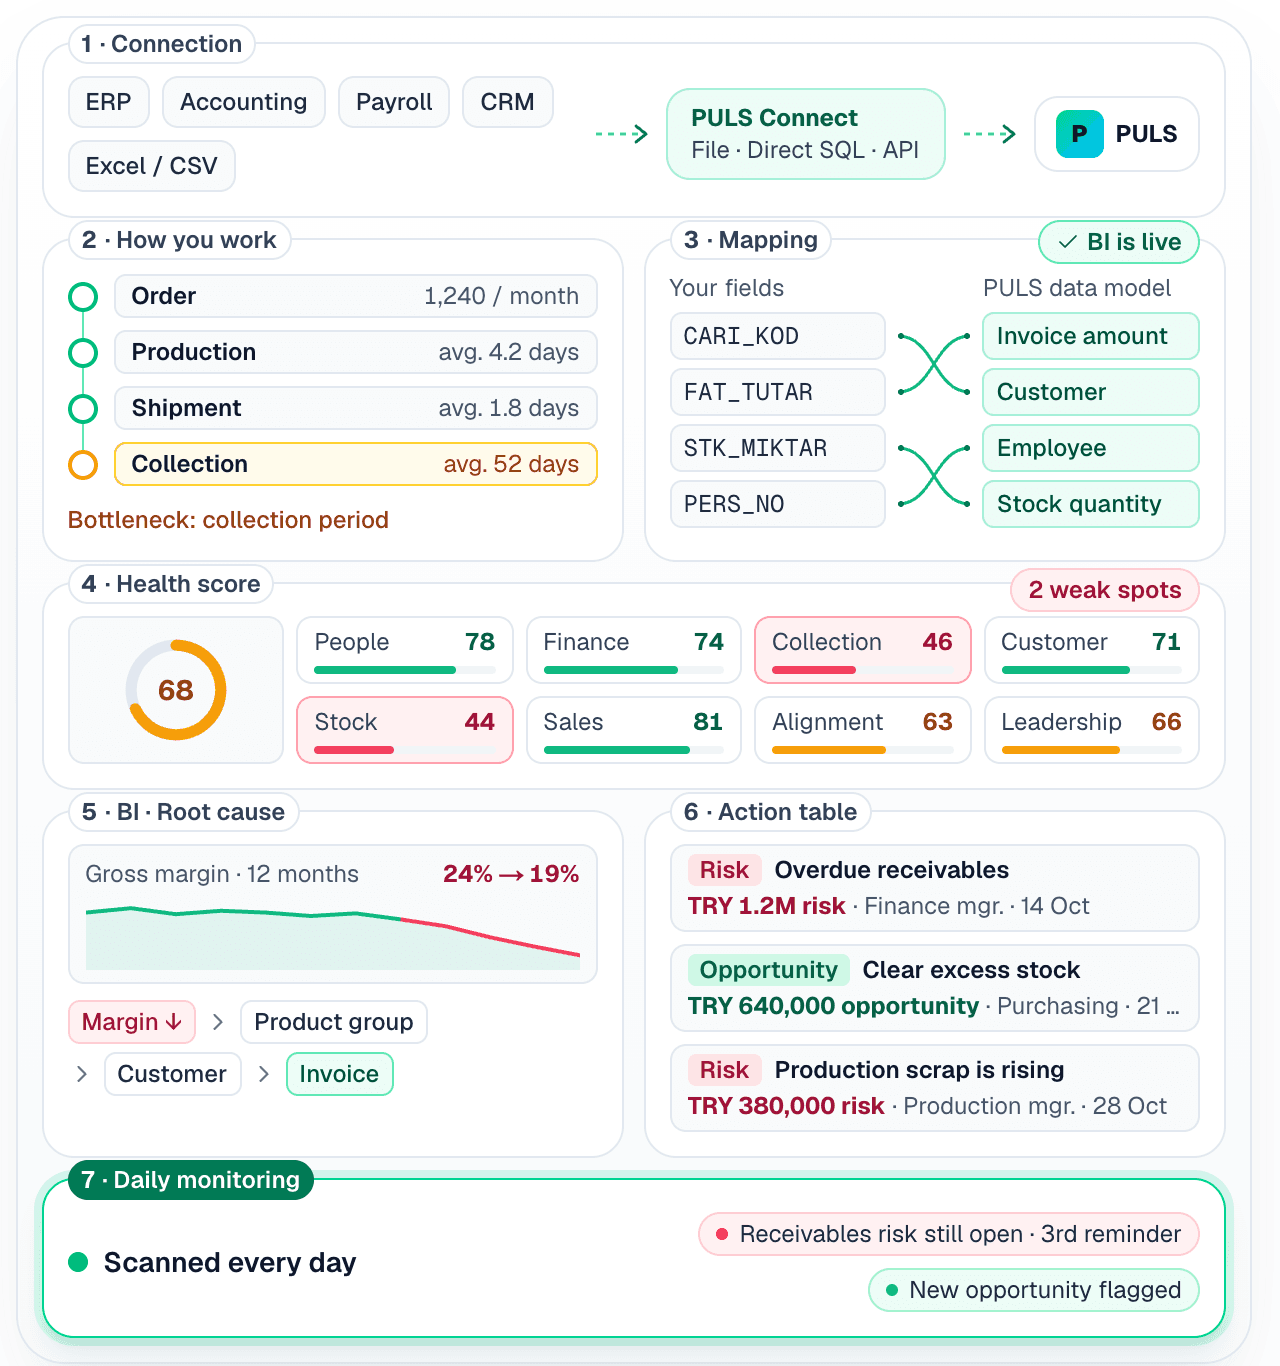
pulsbusiness.app · How it works
PULS works in seven steps: it connects to your data and reveals how you do business.
It measures health, gets to the root cause, and turns risk and opportunity into action.
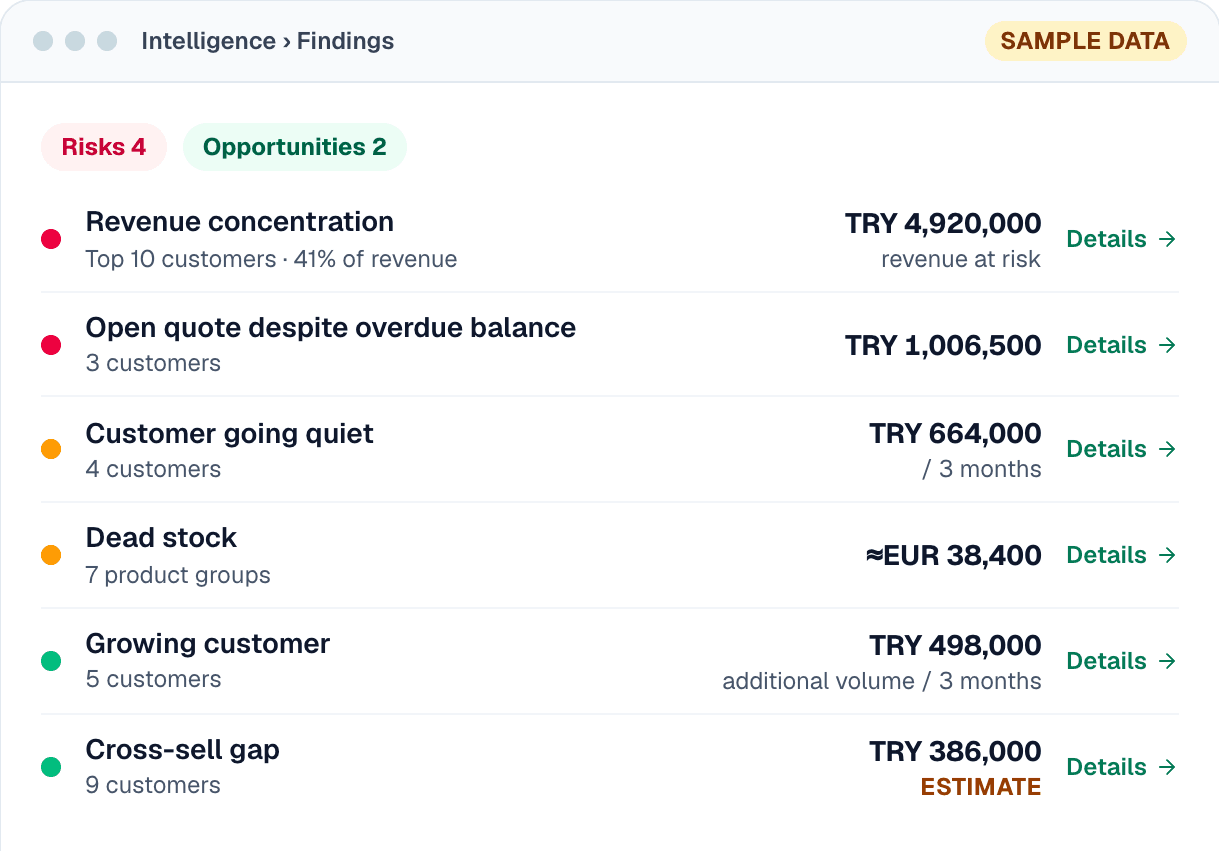
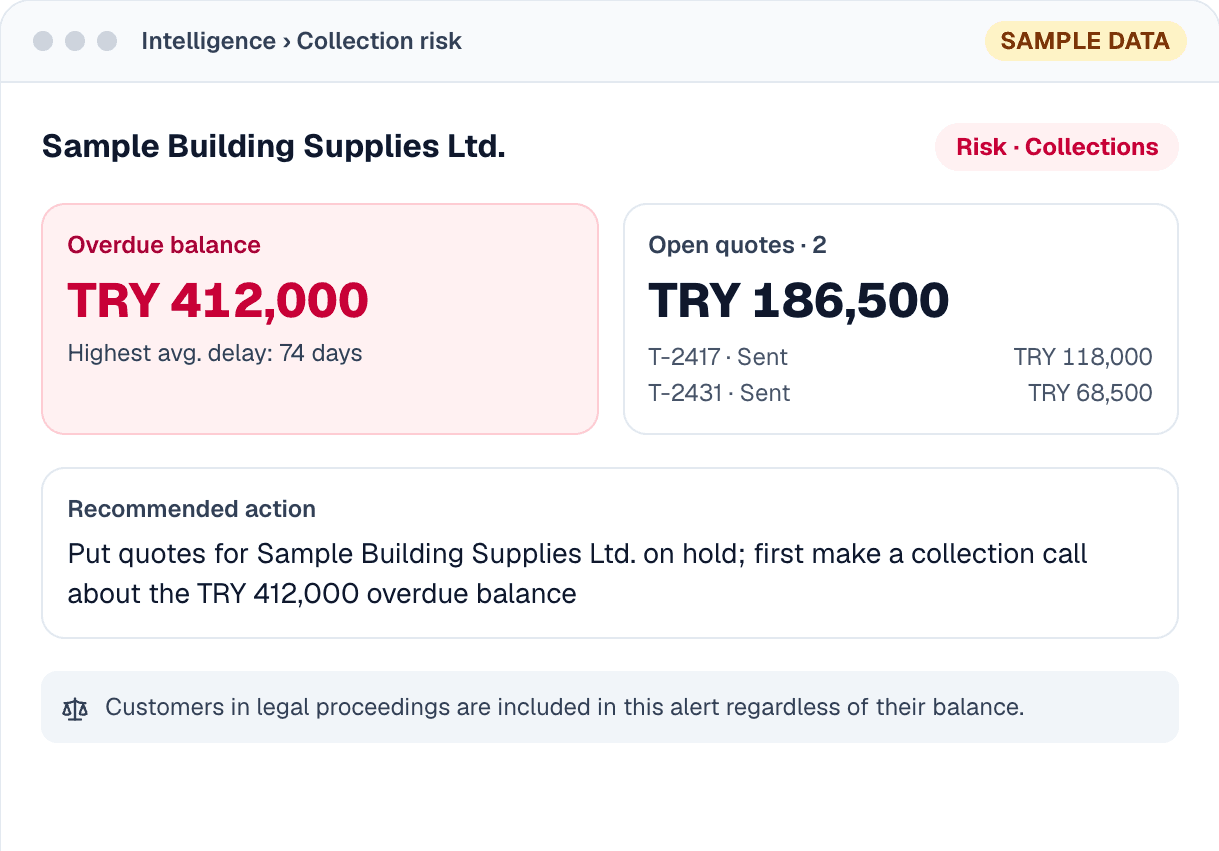
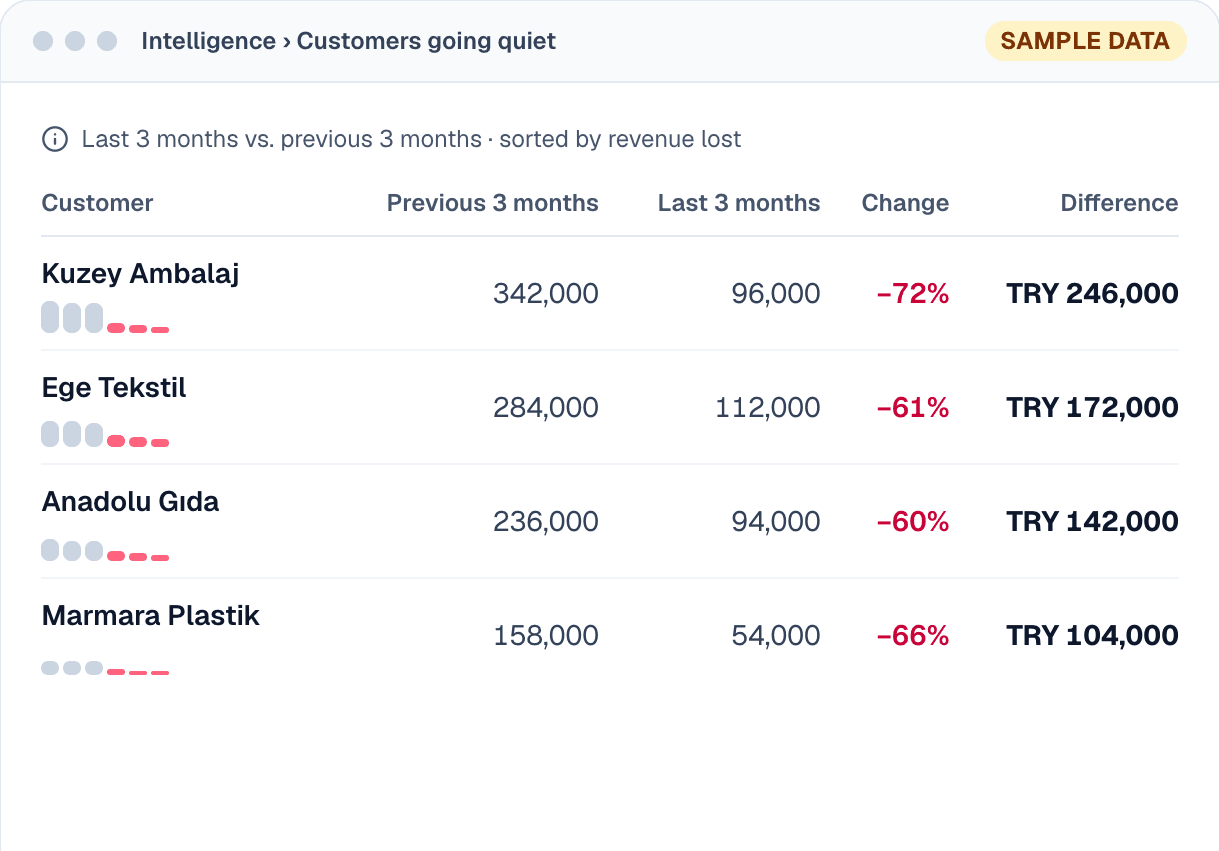
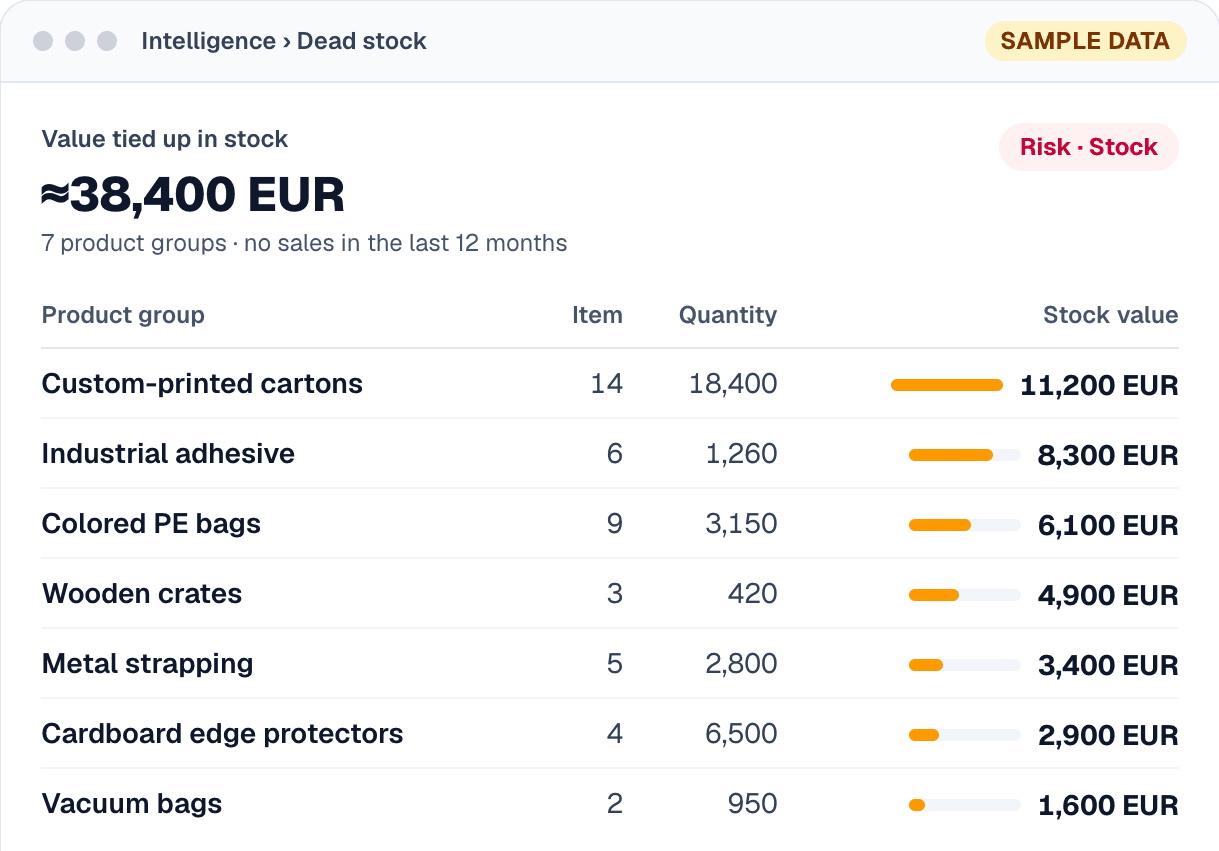
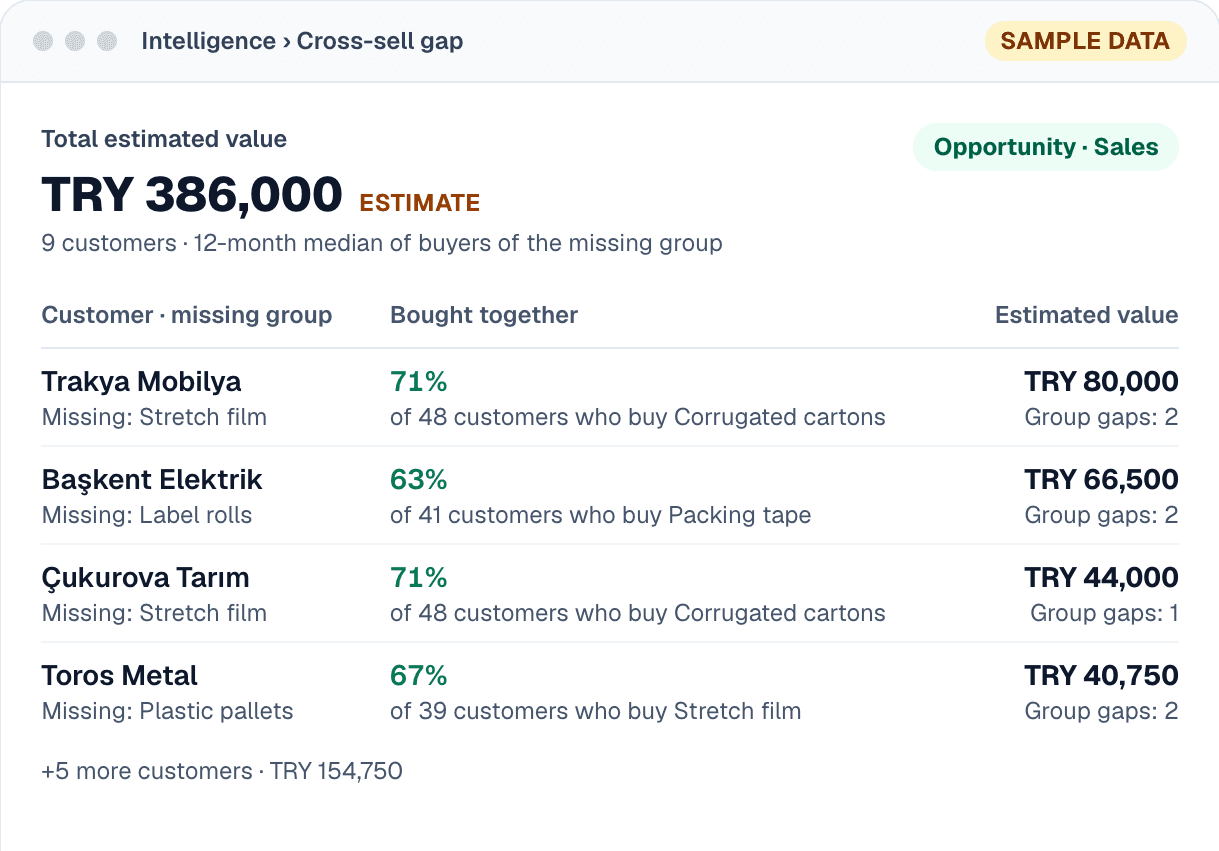
Where is your profit leaking?
If a quote went to a customer who isn’t paying, you should know.
See the customer going quiet, by name, before you lose them.
See the money locked on the shelf, by product group.
See the customer not buying what similar customers buy.
Critical <40Risky <55Watch <70Healthy ≥70
Componentslength = share · thickness = score
Profitability 91Cash 91Debt 99Expense 83Forecast discipline 12
Performance 56Engagement 50Growth 25Visibility 74Alignment 100Leadership 48
Concentration 43Active base 100
Overdue receivables shareAverage delayscore not recorded
Momentum 8Margin discipline 69Brand diversity 83
Idle stock 87Classification 100Warehouse fragmentation 100Turnover rate no data
Purchasing 47Logistics 22Installed Base 60Resolution 57Spare Parts 27Service 17
Due-date adherence 57Capacity utilization no data
Business health: every function’s score, in one ring.
A slice’s length shows its share; its thickness, its score.
Örnek Şirket (demo company) is in the Watch band; collections and operations are critical.
Business pulse52 measures · 13 functions · each dot is one measure
Beat key:▼ down red = threshold breached▲ up green = threshold holds▴ small green = direction known, no threshold— flat = magnitude only
PurchasingDelayed open purchases
₺7,696,672Drill into records →
from 61 records · last record Oct 4, 2026
ReceivablesBalance subject to interest
₺3,180,683Drill into records →
from 28 records · last record Sep 20, 2026
ProductionOverdue work orders
17Drill into records →
from 17 records · last record Sep 28, 2026
Re-measured with the latest imported data each time the page opensAlso: HR · Overdue compliance records · 29
Pulse: each function is a column, each dot a measure.
Threshold breached: down, red. Holding: up, green.
7 measures need attention: they stand out with their amount and records.
You drill into the records; the page re-measures each time it opens.
Opportunity8Missed gain — it has not happened yet.
TRY 2,405,7076 findings unmeasured
8 rising customers — growth momentum TRY 2,405,707
TRY 2,405,707HighSalesCRM
74 materials with over 12 months of stock — open purchase order: 7
≈EUR 15.5MMediumStockSalesPurchasingexcess stock value · not converted to TRY · not in the total
5 customers to win back — revenue lost in the last 6 months
TRY 12,038,027not the amount to be recoveredMediumSalesCRM
Risk16Value about to be lost — it is happening.
TRY 24,817,7246 findings unmeasured
7 suppliers currently late on materials that have no alternative
≈TRY 7M12-month sales of these materialsHighPurchasingSales
9 suppliers have overdue open orders
TRY 7,391,050HighPurchasing
Scanned regularly; again whenever you askIf a problem marked Resolved is seen again, its card reopens by itself.
Also · Lens · Selling Without Stock66 sales SKUs (42.9%) invoiced in 24 months, not in the Sep 20 stock snapshot — 42.5% of revenueHeaviest brand NOVAFLEX · it does not say why; it shows where to look.StockSales
Opportunity and risk are counted on two separate axes.
Each axis has its own amount, severity and trend.
An amount that cannot be measured is not written as zero; it is counted separately.
Scanned regularly; if a problem returns, its card reopens.
Selling without stock: none in stock, yet invoiced.
Receivables, Operations and Sales have problems, Production and HR need attention; the other 3 measured areas are healthy.
There are 24 Opportunities & Risks cards and 5 leave requests awaiting your decision; delayed: 11 order deliveries, 17 work orders and 1 payment promise.
No item is due today; 2 items in total over the next 7 days.
Year performance · 2026arrows: vs. the same period last year
Net revenueJan–Sep 2026
TRY 113.2M
▼ 4.1%
64% of the annual target75% expected by the calendar
Gross profitJan–Sep 2026
TRY 39.9M
▼ 3%
76% of the annual target75% expected by the calendar
Net cashJan–Jun 2026
TRY 3M
▲ 26%
25% of the annual target50% expected by the calendar
Before it’s too late.
Management today: the summary is built only from measured data.
What changed since yesterday, side by side with the targets.
Year performance is compared with what the calendar expects.
The agenda comes from the data: before it’s too late.
PULS Assistant
Customer margin
Ask1In your own words. The query is built from saved metrics; no SQL is written, and it tells you which word it cannot read.
Explorer · answerCustomer margin · Oct 2025–Sep 2026all 35.4%
38.8%
29.8%
39.3%
34.5%
34.2%
40.4%
40.3%
33.5%
Client AClient BClient CClient DClient EClient FClient GClient H
43 customers · margin = profit ÷ net sales · top 8 by revenue · names masked
2The answer comes in the chart, with its denominator.
Workbench · Saved lensesSave the question on screen
Give the lens a name
Save3Name the question you built: it becomes your organization’s lens.
Insights
27lenses
11anomaly
23scanners
427 lenses are measured each time BI opens; 23 scanners run on schedule (13 with “Reports” on) and send deviations to Opportunities & Risks.
Next
“Which customers grew hydraulic pump sales, and which are profitable?”
→ the saved lens runs on its own→ extends to the other product and customer groups
Every question you save becomes your organization’s permanent lens.
You ask the question in your own words.
The answer comes in the chart, with its denominator.
Name it and save it: it becomes your organization’s lens.
27 lenses are measured; 23 scanners run on a schedule.
Next: the saved lens runs on its own.
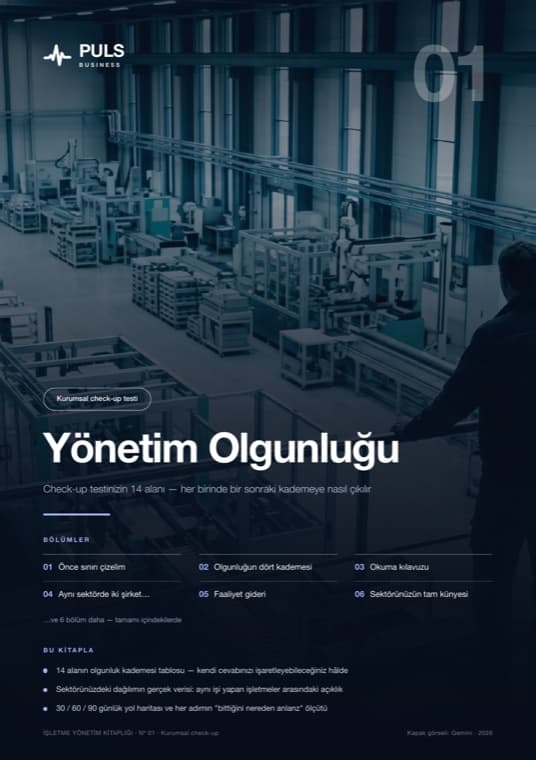
14 areas · ~5 minutes
BookManagement MaturityPDF · free
The score is based on your own answers
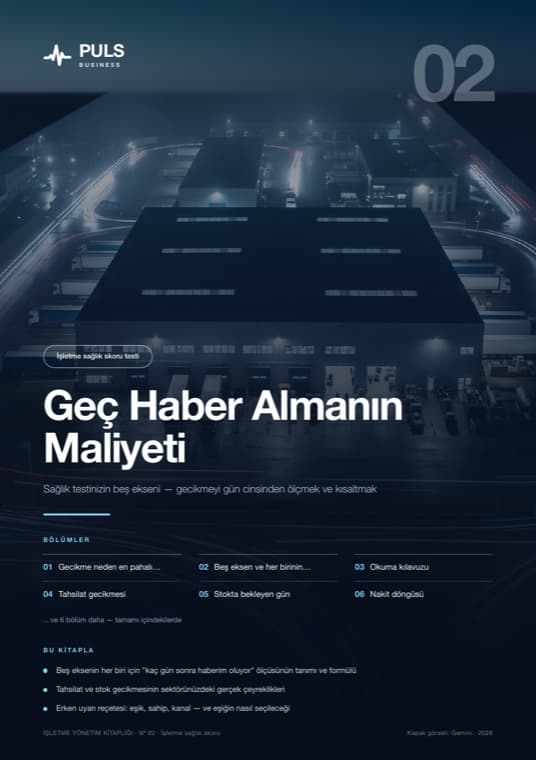
10 questions · 5 axes · ~2 minutes
BookThe Cost of Finding Out LatePDF · free
The score is based on your own answers
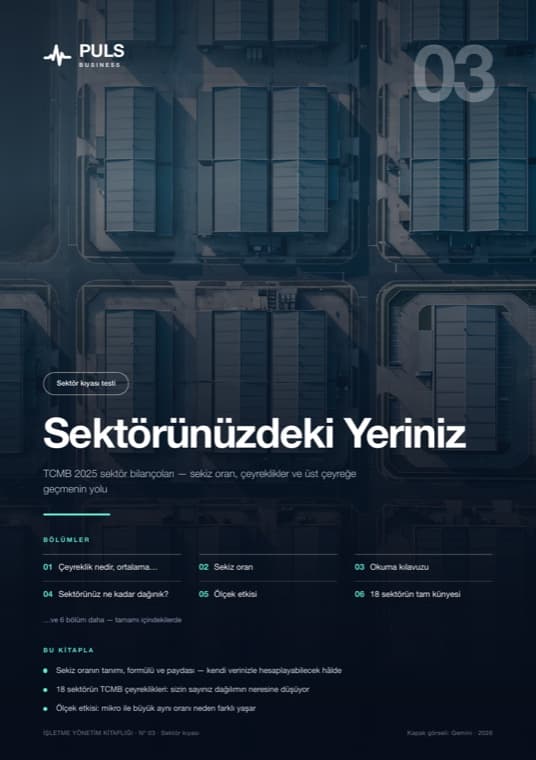
Your own ratios · CBRT quartiles
BookWhere You Stand in Your IndustryPDF · free
Enter the ratios you know
Industry benchmark · sampleCBRT Sector Balance Sheets · 2025 data · NACE 28 Manufacture of machinery and equipment · small size
Gross profit marginhigher is better
the top 25% of the industry5,545 firms
Collection periodlower is better
the top 25% of the industry5,171 firms
Stock turnover periodlower is better
below the median (50–75%)5,055 firms
Self-reported test → data-based PULSTarget: 100 SME check-ups
Entry point: three free tests, each ending with a book.
The industry side is CBRT: more than 5,000 machinery manufacturers.
The test relies on self-report, PULS on data. Target: 100 SME check-ups.
SourceTAM, SAM: OECD 2024 × Eurostat 2025 (different years) · excluding finance, agriculture, mining · wholesale share estimated · areas to scale, SOM ring not to scale · SOM and revenue: founder target
Türkiye: ~60,000 firms with 10+ employees using ERP.
Core: medium-sized manufacturers and wholesalers, ~6,800 firms.
Target 100 firms; in 2027, 25 customers, USD 250,000.
First channel, ERP resellers: from check-up to value analysis, from pilot to license.
Co-Founder · Product and Business Development
ITU Mechanical Engineering · 26+ years in SME manufacturing, B2B industry and consulting
CSO · Sales and Marketing
Bolu Economics · 10+ years of SaaS software sales (SORWE)
CTO · Technical Advisor
Boğaziçi Electrical-Electronics Engineering · ~6 years of IT consulting at Accenture (Europe, USA) · Head of the MIS Department, Marmara University · associate professor (2022)
Alkım Erdönmez — co-founder, product and business development.
Özge Büyükşahin — CSO; 10+ years of SaaS software sales.
Assoc. Prof. Selçuk Kıran — CTO; Head of MIS, Marmara University.
May 5–20
Application · pre-acceptance
pre-jury
Jun 8
ITU Çekirdek acceptance · acceleration program
Jun 11–Jul 16
Courses · end-of-course jury
Jul 31 · Phase 2
14 mentors · pilot work
September
Website · LinkedIn · online check-up · first customer meetings
PULS BI
27 lenses · 23 scanners
2 pilot organizations
100 SME check-up analyses
Pilots at 20 SMEs
Sales to 3 firms
May: application. June: ITU Çekirdek program.
July: Phase 2, 14 mentors, pilot work.
September: website, LinkedIn, online check-up.
Next: 100 SME check-ups, 20 pilots, 3 sales.
investment talks
Our ask: a pre-seed / seed investment conversation.
The investment accelerates the pilots and the channel partnership.
Beyond the money: pilot customer, channel and partner access.
PULS reads, detects opportunity and risk, turns it into action.
Goal: to save money and time — we measure it in the pilot.
From Data to Action — Before It’s Too Late!
PULS reads, detects opportunity and risk, turns it into action.
Goal: to save money and time — we measure it in the pilot.
Product
| Approach | What gets monitored |
|---|---|
| ERP report | Provides templates |
| Business intelligence | You build what gets monitored |
| General-purpose AI | You describe it |
| PULS | Scanning comes built in |
Structural presence/absence only — not a quality comparison.
The problem isn’t missing data — it’s noticing too late.
This is a hypothesis. Goal: to test it with 100 SMEs.
Detected value → realized value · Metric: 6 months · missed value is recorded too
Investor deck
We’ll email you a download link that’s valid for 7 days.