Your existing systems stay in place
Make your business smarter — without changing your ERP
PULS reads the data produced by your ERP, accounting and spreadsheets right where it lives, and turns it into a health score, early warnings and an action plan. Your setup doesn’t change, your processes don’t change — your visibility does.
What you have
Stays in place- ERP
- Accounting
- Payroll
- CRM
- Excel / CSV
PULS Connect
Reads data where it lives. Doesn’t write to your system or change it.
- FileUpload Excel · CSV
- Direct SQLRead-only connection
- APIYour system sends the data itself
What you get in PULS
- Health scoreVisibility, area by area
- Early warningSee weak signals early
- Action planOwner · date · KPI
How it works
From day one to results: PULS in seven steps
The company data shown is sample data; the flow follows the same order as the product.
- 1
PULS connects to your data
Wherever your data lives: ERP, accounting, payroll, CRM or Excel. Your existing systems stay in place.
- 2
Uncovers how you do business
Starts analyzing your data and reveals how your processes really run.
- 3
Puts business intelligence to work
Maps your functions and data structure to the PULS data model; business intelligence works from day one.
- 4
Measures your business health
Combines people, finance, collections, stock, customers, sales and leadership into your Business Health Score; shows the weak spots in each area from day one.
- 5
Gets to the root cause
Builds your BI reports from day one; helps you find the root cause of a problem.
- 6
Turns risks and opportunities into action
Flags the risks and opportunities ahead of you in time, with their cost, and turns them into an action table.
- 7
Never forgets, never lets you forget
Even when you’re not looking, PULS watches every detail at all times; it keeps putting risks and opportunities in front of you until there’s a result.
Free · no sign-up needed
Three tests, three different questions — and a book for each
One measures how you manage, one how late you find things out, and one where you stand in your industry. Doing two of them isn’t redundant — they show different things.
- Results right on screen — Your score, a breakdown by axis, and which PULS screen measures that axis live.
- Every number shows its denominator — Next to every number: how many questions, how many companies and which source it’s based on.
- Finish it, get the book — A PDF book that unpacks the test’s topic; it only asks for your email, and the download link arrives in your inbox.
Yours at the end of the test
Three tests, three books. Each book digs into the topic of its test: quartile tables from the Sector Balance Sheets of the CBRT (Central Bank of the Republic of Türkiye), charts with their sources printed, and formulas you can work through with your own data.
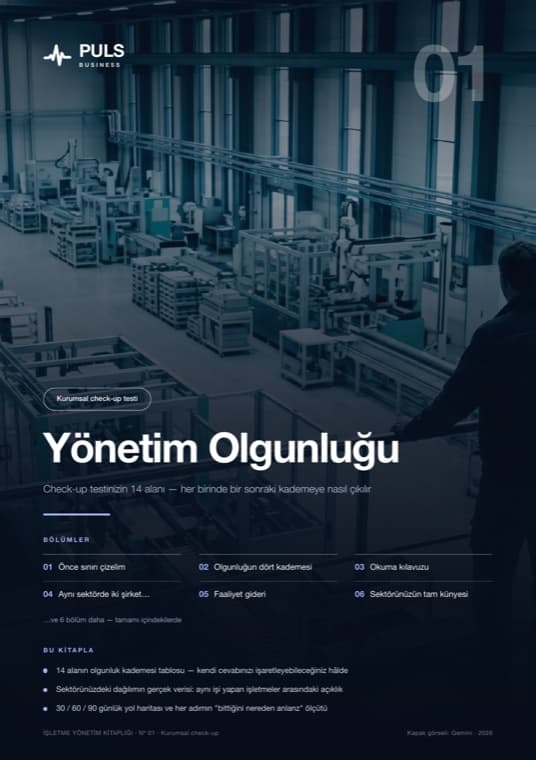

How do you manage each area?
Companion book Management Maturity · 12 chapters · PDF · free
How mature your practices are across 14 areas — where you’re ready and where there are gaps.
- Output:
- 0–100 score + breakdown across 14 areas
- Time:
- 42 questions · ~5 min
How late do you find out?
Companion book The Cost of Finding Out Late · 12 chapters · PDF · free
When you find out your profit, how often you’ve been caught short on cash, when you notice a customer is gone.
- Output:
- 0–100 score + breakdown across 5 axes
- Time:
- 10 questions · ~2 min
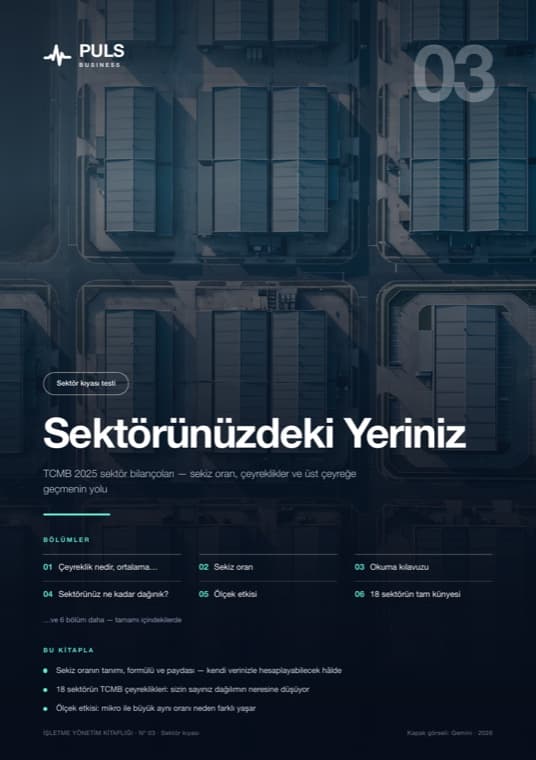
Where do you stand in your industry?
Companion book Where You Stand in Your Industry · 12 chapters · PDF · free
Enter your own ratios and we’ll show you where you sit within the quartiles of the CBRT Sector Balance Sheets.
- Output:
- Quartile for each ratio (not a score)
- Time:
- 8 numbers · ~3 min
All three tests are free and require no sign-up. At the end of each test, you get that test’s book as a PDF; if you’d like us to email you the result and the book, we ask for contact details only at the very end, and it’s optional.
2. Calculate your hidden costs
Inefficient work, operational errors, idle stock, collection delays and customer churn can create costs for your business without anyone noticing.
Estimated annual hidden loss
TRY 12,164,178
This calculation is not a definitive financial report. It’s a preliminary impact simulation based on the assumptions you enter, designed to help management quickly see where hidden losses lie.
Industry benchmark
Measured against yourself, you may look good. But where do you stand in your industry?
PULS compares your company not only with its own past performance but with similar businesses in your industry. That way, you see the real cost of weaknesses you thought were normal.
Revenue per employee
Weak · 25% gapSalary / revenue ratio
Risky · 50% gapStock turnover
Weak · 41% gapCollection period
Risky · 59% gapQuote-to-order conversion
Needs improvement · 33% gapEmployee turnover rate
Risky · 60% gapEngagement score
Needs improvement · 18% gapSample benchmark data — once you’re live, it’s matched to your company’s size and industry.
Balanced Scorecard
Connect people and management health to business results
PULS links people, finance, operations and customer indicators to the perspectives of the Balanced Scorecard. That way, you can see which business result each weak area affects.
Financial
- Unnecessary interest
- Unproductive salary cost
- Idle stock
- Doubtful receivables
- Low profitability
Customer
- Customer churn
- Service quality
- Sales conversion
- Rising complaints
- Customer satisfaction
Internal processes
- Operational errors
- Rework
- Delay
- Departmental friction
- Role ambiguity
Learning & growth
- Loyalty
- Competence
- Leadership
- Potential
- Visibility
| PULS alert | Affected BSC area | Business impact | Recommended action |
|---|---|---|---|
| Low sales team engagement | Customer + Financial | Lost sales / customer churn | Stay interviews |
| Low stock turnover | Financial + Internal processes | Idle capital / interest expense | ABC stock clearance plan |
| Long collection period | Financial | Cash pressure | Collection prioritization |
| Low leadership health | Learning & growth + Internal processes | Declining performance | Leadership development plan |
| Low department alignment | Internal processes + Financial | Wasted resources | Target cascading exercise |
Sample impact map — once you’re live, alerts are generated from your company’s own data.
Early warning
PULS doesn’t just report — it alerts management.
Spots weak signals early, calculates the impact and shows what needs to be done.
Inefficient work / salary cost
Alert: Your personnel costs are above the industry average; revenue and gross profit per employee are low.
Potential impact: Low productivity, excess salary burden, pressure on profitability.
PULS recommends: Role–competency matching, per-employee output analysis by department, low-performance / high-cost matrix.
Operational errors
Alert: Your rate of operational errors and rework is high compared with similar businesses.
Potential impact: Delays, quality costs, customer complaints.
PULS recommends: Process ownership, competency gap analysis, department alignment measurement.
Customer churn
Alert: Despite high sales activity, your conversion and customer retention are low.
Potential impact: Lost sales opportunities, declining customer lifetime value.
PULS recommends: Customer segmentation, sales rep performance map, quote-to-order conversion analysis.
Unnecessary financing costs
Alert: Your collection period and the capital tied up in stock are increasing your financing needs.
Potential impact: Interest expense, cash flow pressure, profit erosion.
PULS recommends: Cash conversion cycle, collection and stock turnover benchmarks, financing cost analysis.
Idle stock
Alert: Your stock turnover is below the industry average.
Potential impact: Idle capital, impairment, warehousing costs, unnecessary purchasing.
PULS recommends: ABC stock analysis, slow-moving stock alerts, cost of capital tied up in stock.
Doubtful receivables
Alert: Some customers are repeatedly paying late.
Potential impact: Doubtful trade receivables, financing burden, disrupted cash flow.
PULS recommends: Customer credit score, collection prioritization, at-risk customer alerts.
How it works
PULS finds hidden losses, puts a cost on them and turns them into action.
PULS Connect
Connects ERP, accounting, payroll, CRM, stock, collections, time & attendance and performance data.
PULS Assess
Measures objectively with tests of competency, engagement, leadership and organizational health.
PULS Benchmark
Benchmarks your company by industry, size and against similar businesses.
PULS Health Engine
Turns every connected area (people, finance, collections, alignment…) into a 0–100 health score; coverage grows as more areas are connected — missing data isn’t estimated, it’s deducted from coverage.
PULS Impact
Calculates the financial, operational and customer impact of weak areas; links it to the Balanced Scorecard.
PULS Action Plan
Turns alerts into actions; sets owners, dates, KPIs and a weekly follow-up cadence.
Output
At the end of the check-up, you get more than a score: an action report you can manage.
Report sections
- 1Business Health Score
- 2People health
- 3Financial health
- 4Operational health
- 5Stock & collections health
- 6Customer health
- 7Industry benchmark
- 8Balanced Scorecard impact map
- 9Risk alerts
- 10Financial impact estimate
- 115 priority actions
- 1230 / 60 / 90-day plan
Priority actions
| # | Risk | Impact | Action | Owner | Date |
|---|---|---|---|---|---|
| 1 | Long collection period | TRY 650K financing cost | Classify at-risk customers | Finance | 30 days |
| 2 | High idle stock | TRY 1.1M tied-up capital | ABC stock clearance plan | Purchasing | 45 days |
| 3 | Low engagement | Loss of key employees | Pulse survey + interviews | HR | 30 days |
| 4 | Operational errors | TRY 1.2M rework cost | Root cause analysis | Operation | 60 days |
| 5 | Low sales conversion | Customer churn | Sales pipeline analysis | Sales | 45 days |
Action cadence
Track targets every week and speed up action.
PULS doesn’t just report your organization’s weak areas; it links them to a KPI table, tracks them weekly against minimum, base and stretch targets, and turns them into a management cadence.
6
Total KPIs
1
Green
4
Orange
1
Red
| Category | KPI | Threshold | Target | Stretch | Actual | Owner | Date | Status |
|---|---|---|---|---|---|---|---|---|
| Finance | On-time collection rate | 75 | 90 | 98 | 82 | Finance | 2026-12-31 | Monitored |
| Sales targets | Quarterly revenue target attainment | 85 | 100 | 110 | 92 | Sales | 2026-09-30 | Monitored |
| Customer segmentation | Share of active customers segmented | 60 | 90 | 100 | 52 | CRM | 2026-08-31 | Critical |
| Organizational structure | Role–competency matrix completion | 70 | 95 | 100 | 100 | HR | 2026-10-31 | Exceeded ↑ |
| Stock | Stock turnover target | 4 | 6 | 8 | 5 | Purchasing | 2026-11-30 | Monitored |
| Operation | On-time delivery rate | 85 | 95 | 99 | 91 | Operation | 2026-09-15 | Monitored |
Sample KPI set — once you’re live, it’s built with your organization’s own targets and owners.
Don’t grow without measuring your company’s hidden losses.
Run your company health check-up with PULS, compare yourself with your industry, see what your weak areas cost and build your action plan.