Hidden capacity: running the factory with OEE in manufacturing
Turkish manufacturing runs at 74.3% of capacity, the euro area at 78.6%. Before buying a new machine, measure what the one you own loses, with OEE.
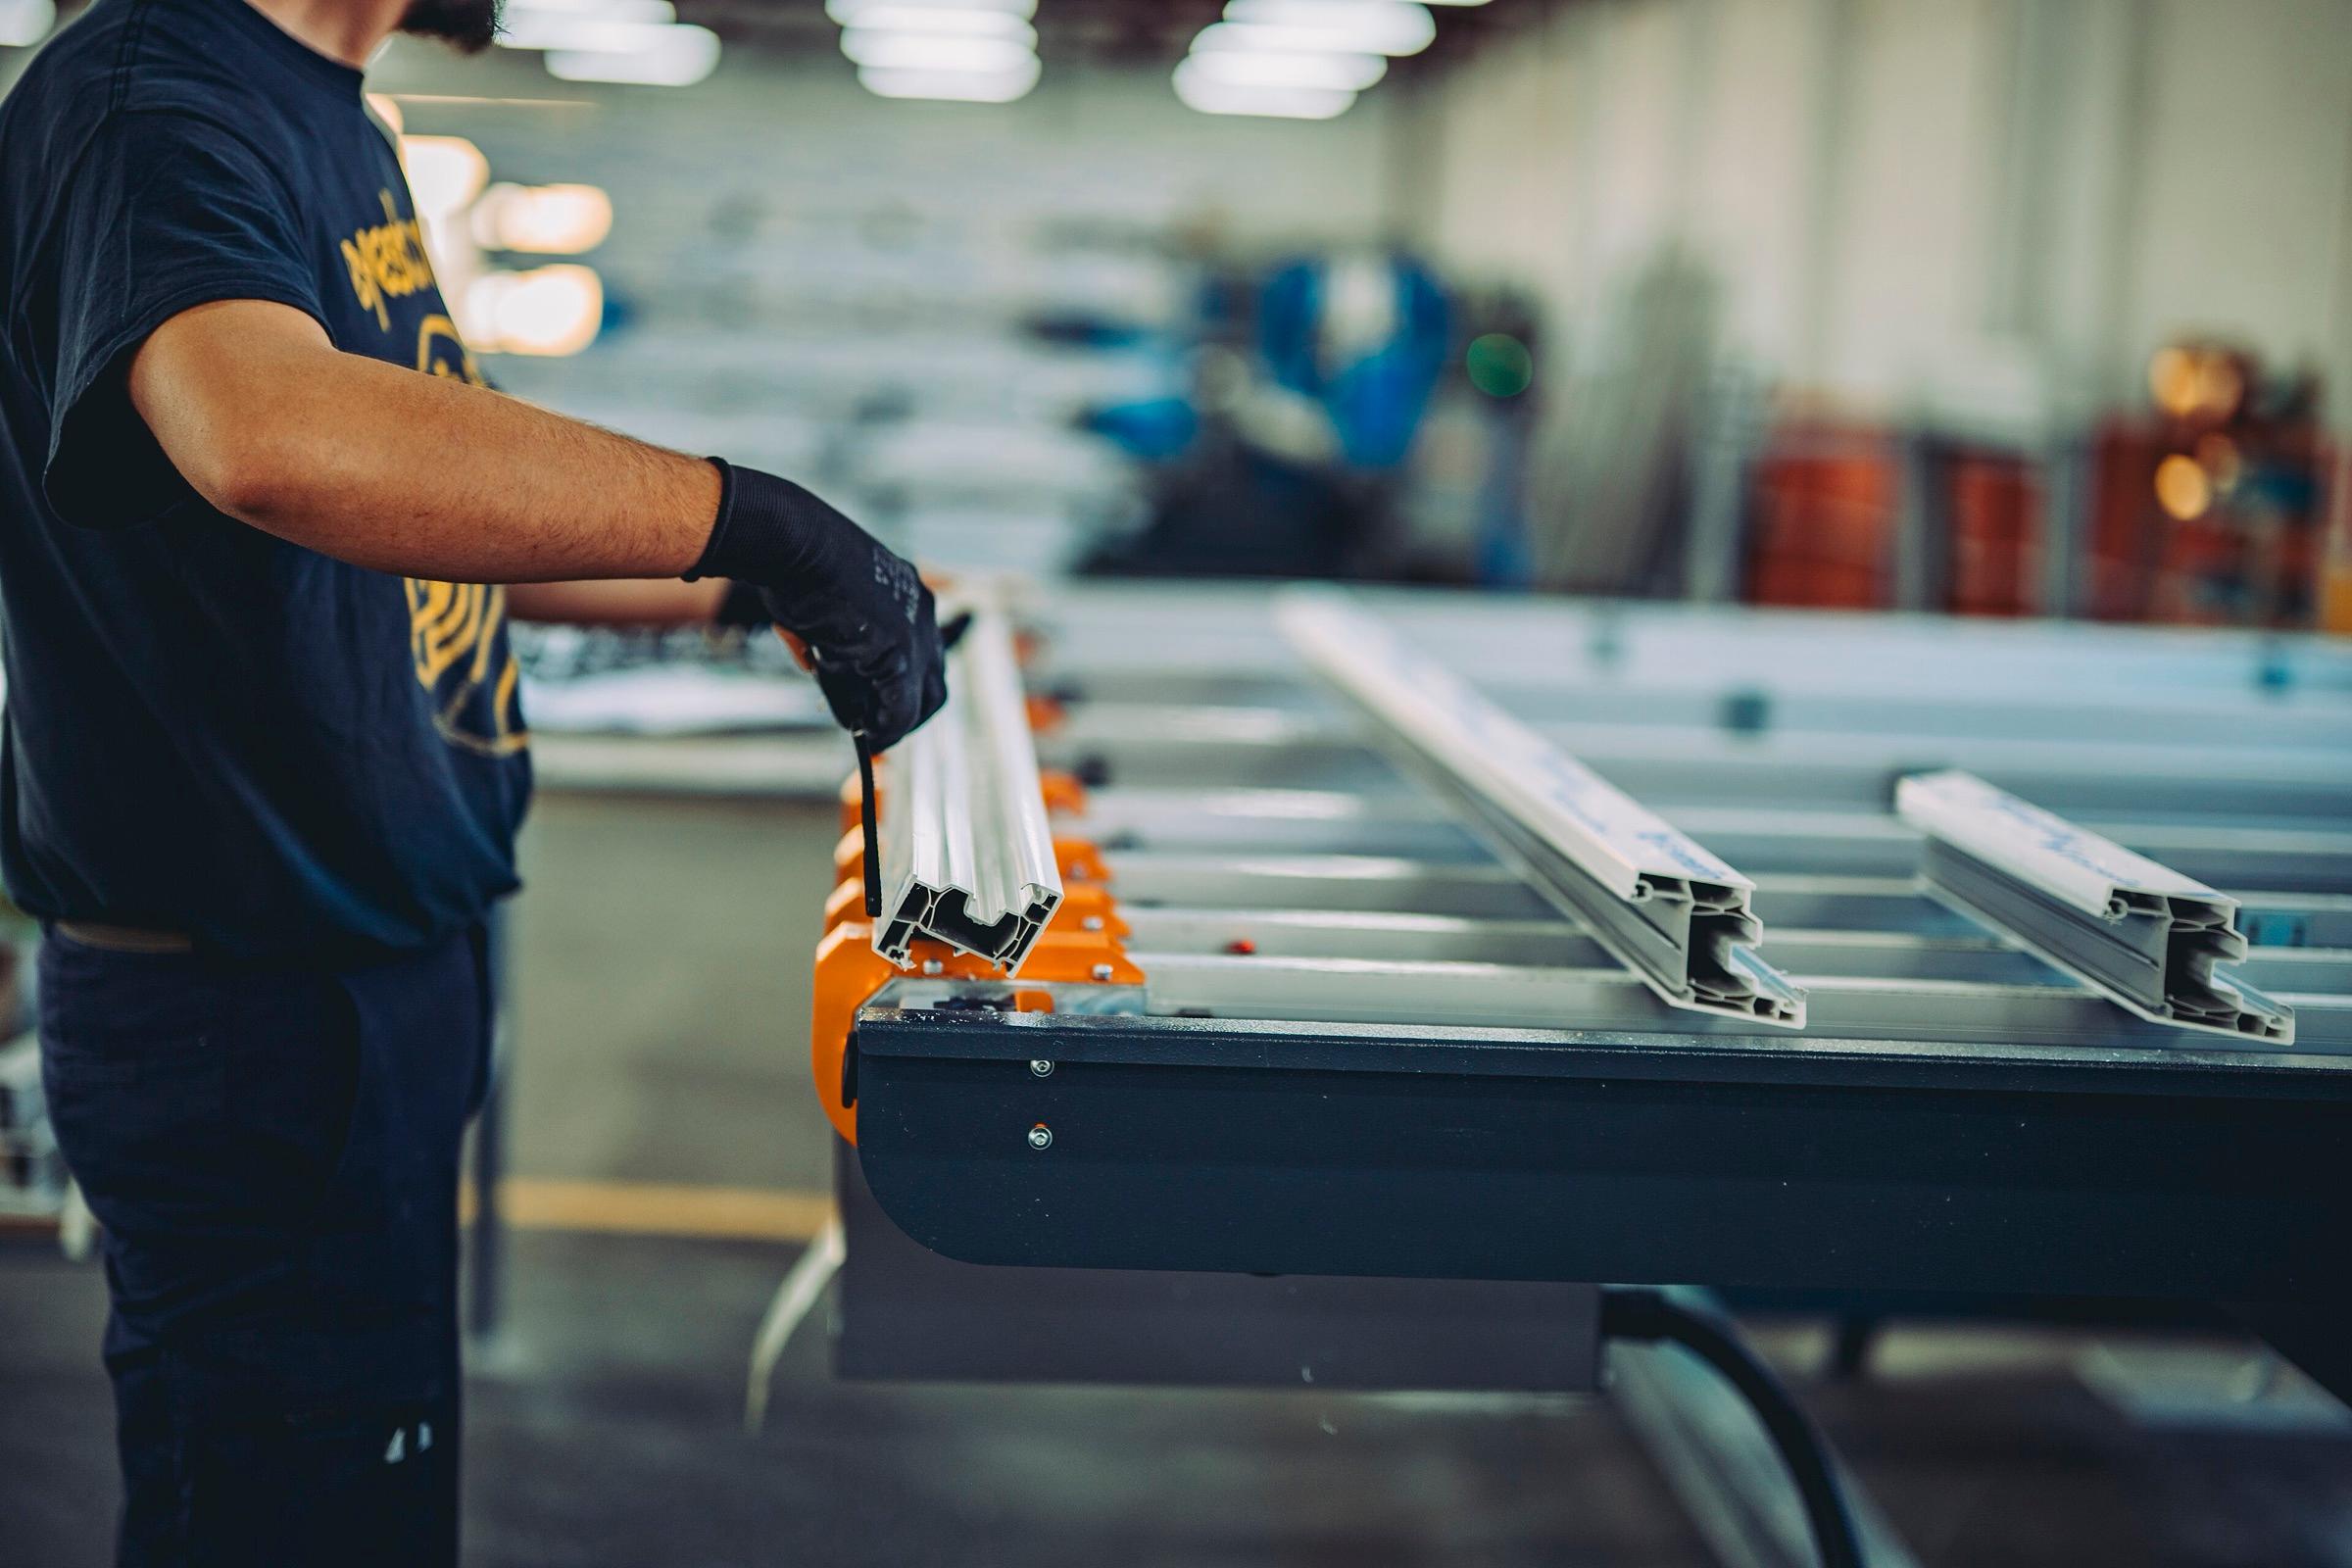 Representative photo · Shixart1985 / Wikimedia Commons, CC BY 2.0
Capacity utilisation in Turkish manufacturing, seasonally adjusted, stood at 74.3% in October 2026 1. Put simply, a quarter of installed capacity is idle. Yet the sentence heard most often on factory floors is still "we're out of capacity, we need a new machine". This article is about the question to ask before making that call: how much does the machine you already own actually produce? The measure is not new. OEE in manufacturing, overall equipment effectiveness, is one of the best-known indicators on the shop floor. What is missing is not the measure but a routine that reads it every day.
Source: TCMB (2026)
According to the central bank of Türkiye (TCMB), whose survey covers 1,965 workplaces, the rate rose 0.2 points on the previous month; a year earlier, in October 2025, it was 74.0% 1. The gap between sectors is wide: in machinery and equipment manufacturing the rate is 64.7% 1. Europe looks somewhat higher but similar. In the European Commission's October 2026 survey, capacity utilisation in euro area manufacturing was 78.6%, while EU industry stood at 78.4%, below its long-term average of 80.3% 2. In Türkiye and in Europe alike, a meaningful share of factory capacity goes unused every day.

- Türkiye, machinery and equipment
- 64.7%
- Türkiye, manufacturing
- 74.3%
- Euro area, manufacturing
- 78.6%
- EU industry, long-term average
- 80.3%
TCMB monthly, seasonally adjusted; European Commission quarterly. The EU long-term average covers all of industry.
A word of caution is needed here. Capacity utilisation is a macro indicator: it asks how much of your installed capacity you used. It does not ask how slowly the machine ran during the hours it was running, or how many of its parts ended up as scrap. The hidden capacity inside a factory sits precisely in the part nobody asks about. The macro rate is therefore a warning, not a diagnosis; the diagnosis is made at machine level.
OEE in manufacturing: three losses in one number
OEE tells you, in a single ratio, how much of the good output a machine could produce in its planned time it actually produced. It is the product of three factors, and each one captures a different loss:
- Availability: for how much of the planned time was the machine actually running? Breakdowns, set-ups and waiting for material show up here.
- Performance: while running, how much did it produce compared with its ideal speed? Minor stops and slow running show up here.
- Quality: how many of the parts produced were right first time? Scrap and rework show up here.
This indicator is not a new invention, nor a company-specific formula. The ISO 22400 series defines key performance indicators used in manufacturing operations management 3, so factory metrics already share a common language. Take a fictional example: in an eight-hour shift a press line stands still for one hour, runs at 90% of its ideal speed while running, and 96% of its parts are right first time. Each ratio looks fine on its own, but multiplied together the line's OEE comes to about 75.6%. In this fictional line, roughly one hour of every four hours of productive capacity quietly disappears. Before buying another press, it is worth pricing what it would take to win back that hour.
The cost of loss: the downtime bill
Public studies that put a price on these losses are rare. One of the most detailed comes from the US National Institute of Standards and Technology (NIST), based on 2016 data. According to NIST, losses from preventable maintenance issues in US discrete manufacturing amounted to $119.1bn in 2016: $18.1bn from downtime, $0.8bn from defects and $100.2bn from lost sales 4. In the same year the maintenance activities themselves cost $74.5bn 4. These figures are for the United States and for 2016; they should not be read as an estimate for Türkiye or Europe. Their proportions are instructive, though: the direct cost of downtime is small next to the sales it costs. The loss is not only at the machine but in the order that ships late.
- Defects
- $0.8bn
- Downtime
- $18.1bn
- Lost sales
- $100.2bn
Source: NIST (2016)
So what is a typical OEE level in factories? We could not find a publicly available study that measures this with a disclosed method; most of the "world-class" figures in circulation are a vendor's or consultant's own claim. So we give no average here. Our suggestion is simpler: measure your own machine's ratio and compare it with last month's. Someone else's average gives you a target; your own series tells you where you are losing.
Five steps before the next machine
- Pick the bottleneck machine. Do not try to measure the whole plant at once; start with the one line that sets your delivery dates.
- Record every stop with its cause. "Stopped" is not enough: breakdown, set-up, material or operator? A stop without a reason cannot be managed.
- Define the ideal speed once. The performance ratio only means something if the ideal cycle time is written down; no shift should invent its own speed.
- Tie scrap to the machine. Quality losses belong on the line of the machine that produced them, not in the warehouse.
- Ask the same question every morning. Which loss was biggest yesterday, and whose job is it? A weekly report comes too late; losses should be read every day.
In an industry where a quarter of installed capacity stands idle, a new machine is not always the answer; often the answer is to see what the existing machine loses. OEE needs no new system for that: production, downtime and scrap are already being recorded. What it takes is a routine that reads those records every day, machine by machine. Hidden capacity becomes visible the day you start measuring it.
Sources
- [1]TCMB (2026). İmalat Sanayi Kapasite Kullanım Oranı — Ekim 2026 — accessed 12 November 2026
- [2]European Commission (DG ECFIN) (2026). Business and Consumer Survey results — October 2026 — accessed 12 November 2026
- [3]ISO (Standards Council of Canada kaydı) (2026). ISO/DIS 22400-2 — Automation systems and integration — Key performance indicators (KPIs) for manufacturing operations management — Part 2 — accessed 12 November 2026
- [4]NIST (2016). Manufacturing Machinery Maintenance — accessed 12 November 2026